Every month your bookkeeper will send you the profit and loss report. You will take it, scan a few numbers, and put it back away without having a clue about what you have just read. This is not your fault since the P&L report is created for accountants and not for those who run the company. The terminology used in such a report can make a simple document incomprehensible.
The trouble is that the P&L report is one of the most valuable documents that can be obtained by an entrepreneur. This report will tell you if your business is profitable, what expenses are reducing your profits, and where your attention should be paid until the small problems become major ones. To learn how to use such a report, you need only one hour of training.
What a P&L Report Actually Shows
A profit and loss statement is a summary of everything that came in and everything that went out over a specific period, usually a month, quarter, or year. It answers one question in different ways. Did the business make money, and where did that money come from or go?
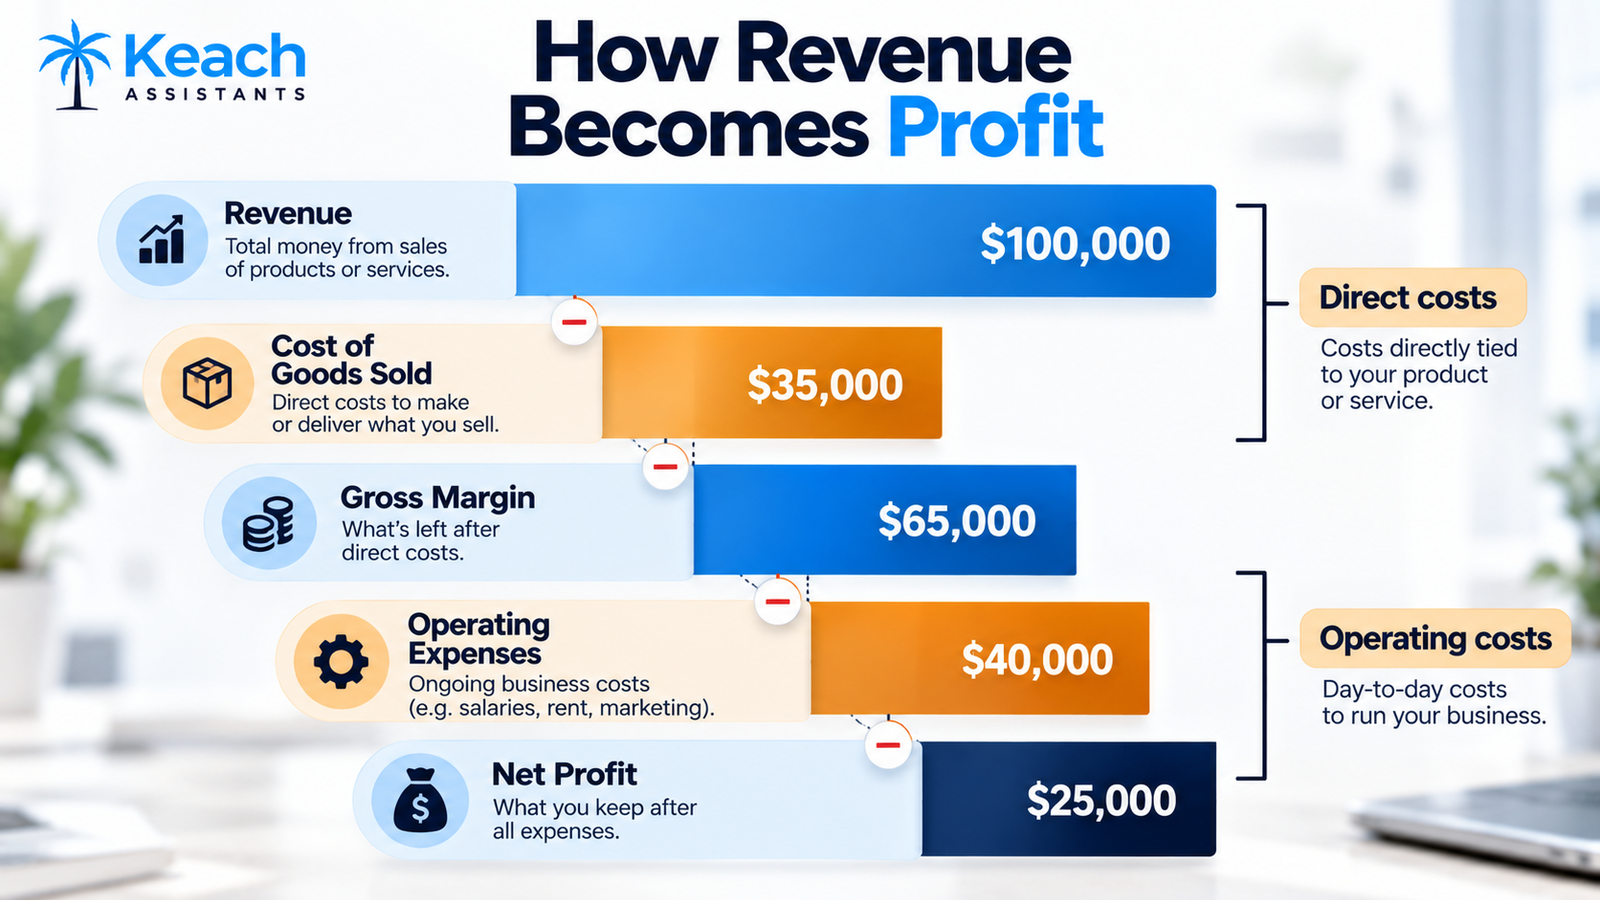
The report is structured in a specific order that mirrors how profit actually accumulates. Revenue sits at the top because it’s the starting point. Expenses get subtracted in groups, and each group reveals a different kind of profit. The bottom line is what remains after everything is accounted for, and that final number is what most people look at first, even though the middle is where the real story lives.
What makes the QuickBooks profit and loss report explained in plain language so useful is that the software does the math automatically. Your job isn’t to calculate anything. It’s to read what the numbers mean and compare them against what you expected.
Understanding Revenue vs Gross Margin
One of the most frequent sources of misunderstanding in regard to the QuickBooks profit and loss is revenue vs. gross margin. Revenue is the total sum of money generated by the business in terms of sales without taking anything off it. Gross margin is the amount of money that is left when all costs associated with delivering the purchased product are taken off the revenue. In other words, all materials, production, transportation, or other costs associated with the saleable products go into gross margin.
This is important because one and the same situation can be characterized both by poor margins and high revenue, as well as low revenue and good margins. The first problem needs to be solved with the help of better pricing policies, while the second problem needs more sales. Thus, the comparison of the two numbers shows exactly what problem the business faces.
Operating expenses are listed separately from the cost of goods and services that influence gross margin. These include rent, subscriptions for software, salaries of administrative personnel, etc. Once they are subtracted from gross margin, the operating profit emerges, which is the true measure of how the business operates.
How Revenue Turns Into Profit: The Complete Breakdown
How to Analyze QuickBooks Profit and Loss Report for Beginners
Learning how to analyze the QuickBooks profit and loss report for beginners comes down to three habits that don’t require any accounting background.
The first way is looking at periods. A month’s Profit & Loss statement says very little since it lacks context. Comparing this month with last month, or this quarter with last year’s same quarter, gives you an immediate picture of trends that would have remained hidden. Increasing revenue combined with decreasing margins could tell you something interesting. Similarly, stagnant revenue and increasing expenses.
The second approach to analyzing a P&L is going through it from top to bottom. It starts with the revenue, moves to gross margin, then expenses, then net profit. Each figure is related to the next, and skipping ahead may make it difficult for you to trace the cause-and-effect relationship.
The third and most important way of analysis is asking yourself two questions: “What changed?” and “Why did it change?” If your marketing expense doubled, what happened with revenue? Did the shipping cost increase due to the volume, rate increases by carriers, or anything else? A P&L will not provide answers to such questions, but it does point you in the right direction.
The Line Items Worth Paying Attention To
Not every line on a P&L carries equal weight, and knowing which ones to focus on saves time during monthly reviews. A handful of categories tend to reveal the most about how a business is actually performing.
- Gross margin percentage, which shows how much of each sale you keep after direct costs.
- Payroll and contractor costs, often the largest single expense category.
- Marketing spend measured against revenue growth.
- Software and subscription costs, which tend to creep upward quietly.
- One-time or irregular expenses that shouldn’t be read as trends.
Subscriptions are worth their own mention because they’re the expense category most likely to balloon without anyone noticing. Small monthly charges feel insignificant individually, but they add up, and they’re rarely reviewed as carefully as larger expenses.
Where the Report Stops and Judgment Begins
The P&L shows you what happened, but it does not say how you should respond to it. This is where the discussion with your bookkeeper comes in handy and where a QuickBooks bookkeeper proves their value more than being just a person posting transactions.
A good bookkeeper will be able to tell you what expense categories have grown in volume, what items on the P&L seem strange in relation to other periods, and what figures deviate from your expectations. In addition, they will help you identify what could have gone unnoticed by you, such as a client accounting for an unhealthily large proportion of sales or a certain category of expenses growing steadily over three months.
The decisions will remain yours to make, but having a person who will help you understand these figures in context will greatly simplify the task.
When the Numbers Stop Making Sense Alone
There’s a point where reading a P&L becomes less about the report itself and more about the systems behind it. If you’re not sure whether the numbers are accurate, or if you’re spending more time reconciling than analyzing, the underlying bookkeeping process is probably the problem rather than the report.
That’s often when owners start looking for outside help, and it’s worth understanding whether freelancers really need a virtual bookkeeper or whether the answer depends on something else entirely. For growing businesses, the question usually isn’t whether help is useful but when it becomes necessary, which is exactly what guides conversations about when it is time to hire a remote bookkeeper for a small operation that’s outgrown its current setup.
There’s also a practical layer that sits underneath all of this. Invoices need to go out, payments need to be tracked, and the data feeding into your P&L has to be accurate in the first place. That’s part of why so many businesses rely on a bookkeeping virtual assistant to handle invoices and late payments alongside the reporting itself, since clean books and clean cash flow go together and neither works well without the other.
Conclusion: Reading the Story Behind the Numbers
A P&L report isn’t just a financial document. It’s a narrative about how your business performed over a period, and the better you can read that narrative, the better your decisions get.
Keach Virtual Assistant works with business owners who want their QuickBooks kept clean and their reports explained in terms that actually make sense. Whether you need monthly bookkeeping, invoice support, or someone who can walk you through what the numbers mean, the goal stays the same. Financial clarity you can act on.
Ready to Understand Your Numbers Instead of Guessing?
Keach Virtual Assistant keeps your QuickBooks current and your reports readable.
FAQs
How often should I look at my P&L statement?
At least monthly for most businesses, with a more detailed one quarterly. Monthly will help you spot any problems early, while a quarterly review will be enough time for trends to become apparent.
What’s the difference between gross profit and net profit?
Gross profit is the amount of money that’s left after you take away the cost of providing what you’ve sold. Net profit is the amount of money that’s left after you have taken everything away from your income.
Is it possible to understand P&L without accounting knowledge?
Yes, most entrepreneurs understand P&L statements without having accounting knowledge. The structure of the report is logical and easy to understand when you know your revenue, gross margin, operating expenses, and net profit.
Why am I profitable according to my P&L but have no money in the bank?
The P&L and cash flow are separate. You could be profitable in a given month but not have enough cash because customers have not paid, you purchased stock, or loans were due. The P&L does not record cash flow.
How do I determine whether my P&L is accurate?
How are the transactions posted? Are reconciliations done monthly? If the accounts are straight and get reconciled monthly, chances are that the P&L is accurate.